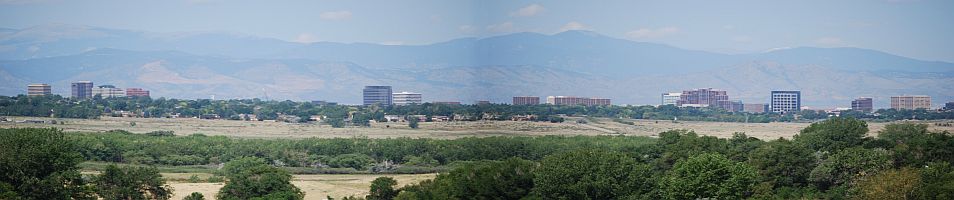
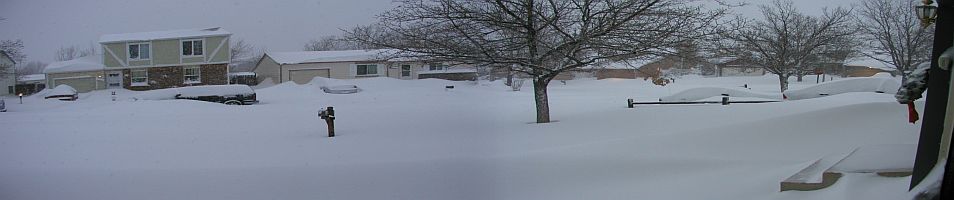
 TigerDenWX Aurora, Colorado, USA!


TigerDenWX All time Records
Records began on May 17, 2012. Here are the extremes recorded since then. .
| Temperature and humidity | |||
| Highest Temperature | 104.7 °F | at 4:43 PM on 23 June 2012 | |
| Lowest Temperature | -12.1 °F | at 8:02 AM on 22 December 2022 | |
| Highest Minimum | 72.3 °F | at 4:38 AM on 18 July 2022 | |
| Lowest Maximum | 3.2 °F | at 12:57 PM on 30 December 2014 | |
| Highest Apparent Temperature | 100.8 °F | at 3:08 PM on 05 August 2022 | |
| Lowest Apparent Temperature | -18.9 °F | at 8:02 AM on 22 December 2022 | |
| Highest Heat Index | 97.7 °F | at 3:08 PM on 05 August 2022 | |
| Lowest Wind Chill Temperature | -17.9 °F | at 1:52 AM on 31 December 2014 | |
| Highest Dew Point | 69.2 °F | at 5:16 PM on 13 June 2021 | |
| Lowest Dew Point | -43.1 °F | at 4:48 PM on 21 January 2014 | |
| Highest Humidity | 100% | at 1:36 PM on 12 September 2013 | |
| Lowest Humidity | 0% | at 1:12 PM on 21 January 2014 | |
| Largest Daily Range | 90.6 °F | on 26 May 2012 | |
| Smallest Daily Range | 2.2 °F | on 14 March 2024 | |
| Rainfall | |||
| Highest Rain Rate | 48.00 in/ht | at 12:16 PM on 09 March 2020 | |
| Highest Hourly Rainfall | 1.84 in/hr | at 4:30 PM on 15 August 2022 | |
| Highest Daily Rainfall | 3.09 in | on 12 September 2013 | |
| Highest Monthly Rainfall | 9.47 in | September 2013 | |
| Longest Dry Period | 44 Day | to 22 October 2020 | |
| Longest Wet Period | 8 Day | to 13 February 2020 | |
| Wind | |||
| Highest Wind Gust | 49.0 mph | at 3:43 PM on 17 April 2018 | |
| Highest Wind Speed Average | 21.0 mph | at 4:00 PM on 17 April 2018 | |
| Highest Daily Wind Run | 212.0 miles | on 05 March 2018 | |
| Pressure (sea level) | |||
| Lowest Pressure | 28.875 in | at 10:05 AM on 13 March 2019 | |
| Highest Pressure | 31.017 in | at 10:39 AM on 30 December 2014 | |
Page updated : 9/24/2024 11:20:01 PM
powered by Cumulus 1.9.4 (10991)
